Ever Wonder How Much Your House is Worth on Airbnb
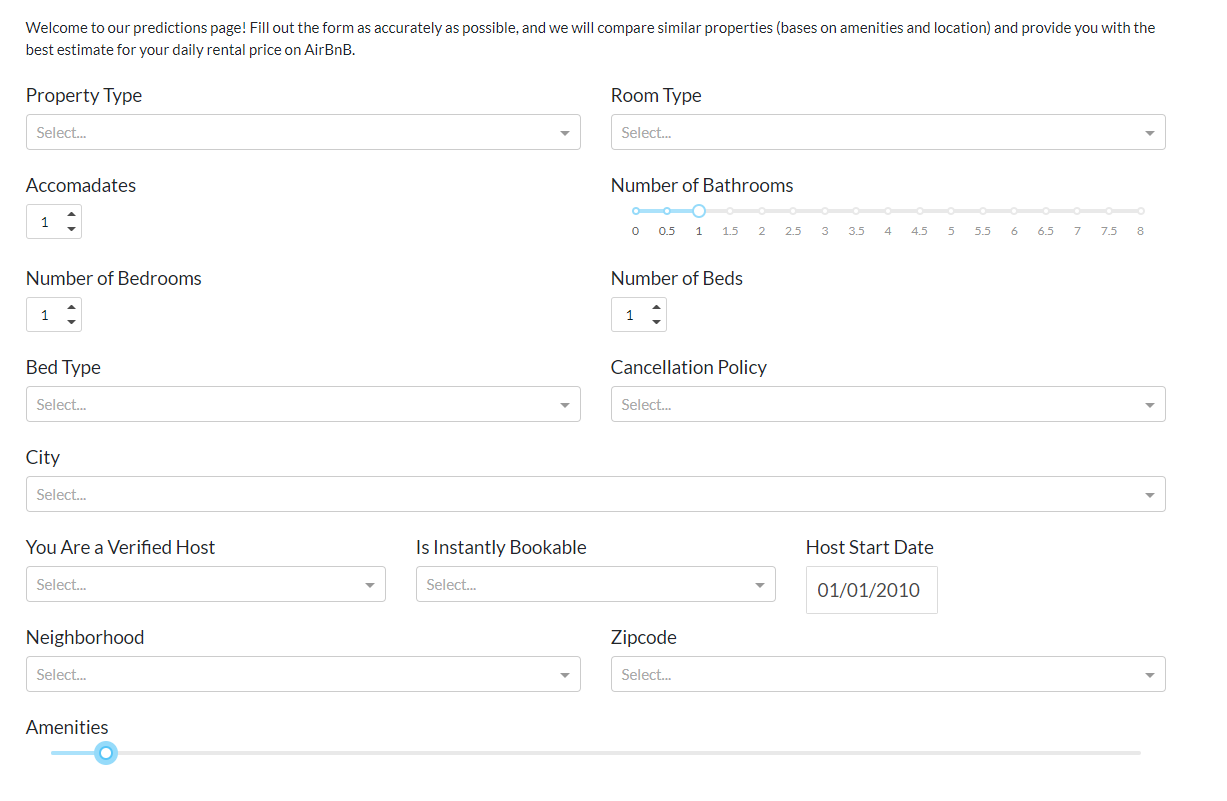
Did you ever wonder how much your property is currently worth on the market? Maybe, you’re taking a 3 month vacation overseas and wanted to rent out your apartment while you were traveling. Or maybe you’re blessed enough to own multiple properties, and therefore have the opportunity to rent one of them out for a price. But there’s a problem. There’s no simple way to predict the daily rental price of your property. Luckily for you, we (a team of 4 data scientists) created a web app that predicts your daily rental price based off a simple form filled with the features shown in the below image.
Sounds Too Good to Be True. Can We Trust You?
Of course you can! Well…at least if you live in Los Angeles, New York City, Chicago, San Francisco, Boston, or Washington DC. We used a a robust dataset (~75,000 lines) that we found on Kaggle that had a lot of relevant features that other datasets didn’t have such as number of bedrooms, bed type, room type, and much more when compared to the official current Airbnb data. However, some disadvantages using this dataset when compared to the official Airbnb data is:
- the Kaggle data was based on 2019 data whereas the Airbnb data would be 2021
- the Airbnb data had access to much more cities
However, since the main goal of this project was to predict the daily rental price based off a variety of features, and in order to best utilize a Keras machine learning model, we chose the dataset with more features (whereas the Airbnb data only had neighborhood and room type as features)
How Does It Work? Is It Reliable?
So now that we have the data, how did we actually utilize the data to predict a daily Airbnb price? As alluded to previously, we used a Keras sequential neural network model to take in all the features the user chooses, and based off the user’s choices, the model would predict the daily rent price. (For a more in-depth, entry level look at machine learning model, Thomas Countz has an excellent article that describes how they work, and it largely applies to our Keras sequential model)
# Mode-building Imports
from keras.callbacks import ModelCheckpoint
from keras.models import Sequential
from keras.layers import Dense, Activation, Flatten
from sklearn.preprocessing import OrdinalEncoder

# Creating input dimensions for keras model
input_dims = len(X_train_whole[0])

# Instantiating the model
model = Sequential()

# Model Layers
model.add(Dense(input_dims,input_dim=input_dims, activation="relu", kernel_initializer='normal'))
model.add(Dense(1,activation="linear",kernel_initializer='normal'))

# Compiling the model
model.compile(loss='mean_squared_error', optimizer='adam', metrics=['mean_absolute_error'])

# Fitting the data to the model
model.fit(X_train_whole,Y,epochs=10, batch_size=32, validation_split = 0.2)
If one is versed in Keras, we only added one dense layer besides the input layer, which is actually very small. The reason being is that our data isn’t super complicated in that the features were relatively simple. For example, some common cases of using complex machine learning models is to use it for natural language processing (e.g., an AI learning a new language, and predicting if the language is profane) or for image processing (cleaning up old images to create higher definition images). In reality, since our data was so simple, it’s likely that using a regular ridge regression model (while encoding the categorical variables) would yield similar results. However, since our model was to apply some of our learning from Lambda School regarding neural networks, we went ahead and used a Keras Sequential model. After we trained the model, we wrote the below code to predict the daily rental price based off the users inputted features on our web app.
def get_prediction(df):
    # categorical features
    string_variable_list = ['property_type','room_type','bed_type',
                   'cancellation_policy','city','host_identity_verified',
                   'instant_bookable','neighbourhood','zipcode']

    # numerical features
    number_variable_list = ['amenities','accommodates','bathrooms','beds','bedrooms','host_since_days']

    # empty feature lists that will be used for predictions
    number_value_list = []
    string_value_list = []

    for x in string_variable_list:
        string_value_list.append(df[x])
    for x in number_variable_list:
        if type(df[x]) != str and type(df[x]) != np.int64 and type(df[x]) != np.float64 and type(df[x]) != np.bool:
            number_value_list.append(mt.get_days(df[x]))
        else:
            number_value_list.append(df[x])

    # vectorize the strings so the model and add to the number_value_list as whole_input_vector
    string_vectorized= oe.transform(np.array(string_value_list).reshape(1,-1))
    whole_input_vector = string_vectorized[0].tolist() + number_value_list

    # get a df for debugging purposes
    confirm_df = get_confirm_df(string_vectorized,number_value_list,string_value_list)

    # predict the daily rental price based on inputted features and return confirmation df for debugging purposes
    prediction = model.predict(np.array(whole_input_vector).reshape(1,-1))
    return prediction[0][0],confirm_df
What the code simply shows is that if the user inputted a feature with text (i.e., they chose their city as “Los Angeles”), the model would convert it to an encoded number. After it encoded all the features with text, and combined it with the features that were originally numbers (i.e., beds = 2), the model could then predict the daily rental price. The reason we had to convert the text to numbers, is that when we trained the Keras sequential model, we converted the text to numbers using an ordinal encoder. Technically, it wasn’t completely necessary but it arguably simplified the process and made it simpler.
Hmmm. I Think I Trust You Now. But Was It Easy Launching It Publically Online?
Now that I’ve explained how we used the Kaggle data to train a Keras Sequential model in order to predict a daily rent price, I can go into the technical aspect of how we created the web app. We utilized Plotly Dash, a productive Python framework for building web analytic applications, to design and create the app. The app mainly uses Python with some HTML components to design the app, as seen below.
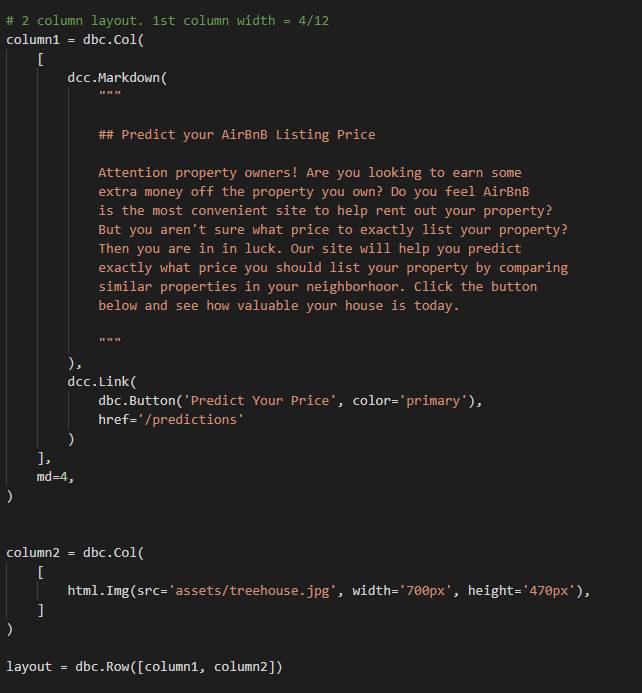
As you can see, plotly dash has incorporated html elements in order to create the app, however, overall the code is still in a .py file. This incorporation of html makes it easier to format the page, similar to how one might do in html. The above picture showed how the homepage of the app was created.
Another advantage of using plotly dash is that they have created components that help creating the entry form much easier. For example, in order to create a dropdown menu, we just needed to use the following code.
dbc.Col(
                    [
                        dcc.Markdown("##### Room Type", className='mb-1'),
                        dcc.Dropdown(
                            id='room',
                            options=[
                                {'label': 'Entire Home/Apartment', 'value': 'Entire home/apt'},
                                {'label': 'Private Room', 'value': 'Private room'},
                                {'label': 'Shared room', 'value': 'Shared room'}
                            ],
                            className='mb-4',
                        ),
                    ],
                ),
They also had created components for all types of user inputs such as sliders, checklists, calendars, and much more. This suited our app as shown previously, our app relies heavily on user inputs. One particular feature that was useful, was that for the dropdown, it allowed users to type in the dropdown menu to quickly search for their desired input. This was essential for our Neighborhood feature since there could be hundreds of neighborhoods in a city and :
- the model could only predict on the available inputs (i.e., it would break if a user typed a neighborhood that didn’t exist in our database)
- it let the user efficiently find the desired neighborhood
Now That You Know How It All Works, Predict Away
Hopefully now that you know how our app works from the bottom to top, and are able to trust how we’re able to predict daily rental price in select major cities in the United States of America, please feel free to visit our app and predict away. To note, since we deployed using a free account on Heroku, the app may take some time to load.
Link to GitHub repo can be found here